Reading the Labour Force Data: What the Headlines Miss

The spark
The ABS released its latest labour force data on 16 April 2026. Within hours, the comments section under the 9 News coverage filled with familiar claims: everyone is getting second jobs just to survive, migrants are taking all the jobs, the economy is broken and the government is hiding it.
These concerns are worth taking seriously. People’s lived experience of financial pressure is real, and dismissing it helps no one. But feeling something and measuring it are two different things. To understand what is actually happening in Australia’s labour market, we need to look past the comments and into the data.
The data
Everything in this analysis comes from the Australian Bureau of Statistics, specifically the Labour Force Survey (Cat. 6202.0), the Multiple Job-holders release (Cat. 6217.0), and the Labour Force Detailed pivot tables (LM5). All figures are seasonally adjusted unless noted. The data spans from 1978 to March 2026, depending on the series.
The data was cleaned and visualised in Tableau.
The shock and the recovery
Between a pandemic, a global economic slowdown, and the rise of AI, you would expect Australia’s labour market to be in trouble. The headline numbers tell a different story. But headline numbers do not tell the whole story.
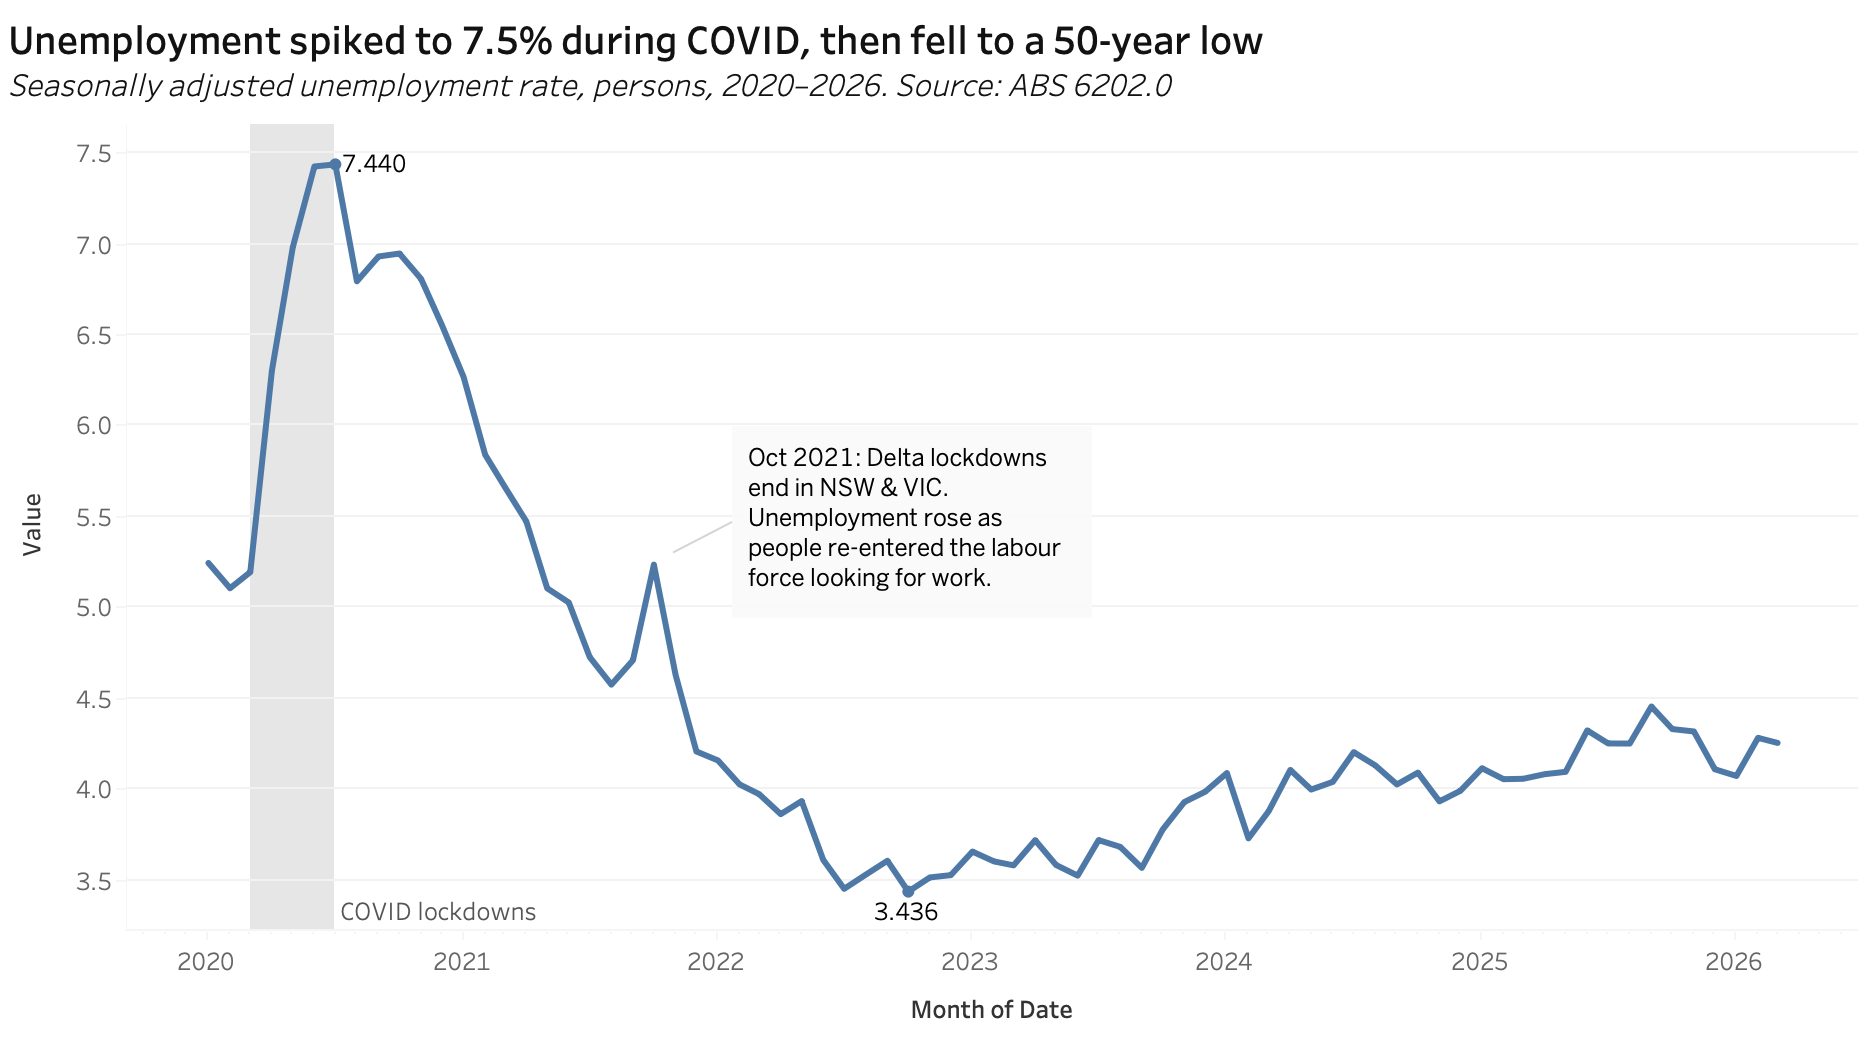 During the first wave and strongest COVID hit, in April 2020, unemployment spiked to 7.4% as the first national lockdown shut down large parts of the economy. By late 2022, it had fallen to 3.4%, a 50-year low, well below where it sat before the pandemic. As of March 2026, it sits at around 4.3%.
To put that in a numeric perspective: Australia’s labour force is roughly 14.8 million people. Each percentage point of unemployment represents about 148,000 people. The drop from 5.2% pre-COVID to 3.4% at the trough meant roughly 266,000 fewer Australians out of work. The current level of 4.3% translates to about 659,000 unemployed people, which is lower than it was going into the pandemic.
Internationally, Australia sits comfortably below the OECD average unemployment rate of 5.0%. Among 38 OECD countries, Australia ranks around 10th to 12th lowest for unemployment, and its employment rate of 77% for working-age adults is above the OECD average of 72%. Japan and Mexico lead the OECD at around 2.5%, while Spain and Finland sit above 10%. Australia is not the best, but it is firmly in the top third.
By every headline measure, the Australian labour market came out of COVID stronger than it went in. But if the numbers look this good, why does it feel like things are getting worse? We hear constantly about companies cutting staff, AI replacing roles, and a global economic slowdown. Yet the unemployment rate barely flinches.
Part of the answer is definitional. The ABS counts anyone who worked even one hour in the survey week as employed. A person who lost a full-time corporate role and picked up a few hours of gig work is statistically “employed” even if their income halved. The headline unemployment rate does not capture this kind of downgrade. A broader measure, the underutilisation rate, which combines unemployment with underemployment (people working but wanting more hours), sits at around 10% to 11%, roughly double the headline rate. That gap between 4.3% and 10% is where much of the lived frustration sits.
The other part is sectoral. The layoffs making news headlines, tech companies, consulting firms, media organisations, are concentrated in industries that are visible and vocal. Meanwhile, healthcare, construction, and aged care have been adding jobs at record pace. The economy is not shedding jobs overall. It is rearranging them, and the people being rearranged are often the ones with the loudest platforms.
By the headline measures, Australia’s labour market has not just recovered from the pandemic. It has come out ahead. But the headline measures were never designed to capture the full picture, which tells a more complicated story.
The nature of work
Beyond the headline unemployment rate, two structural shifts are reshaping how Australians work: the long-term rise of part-time employment, and the growing number of people holding more than one job.
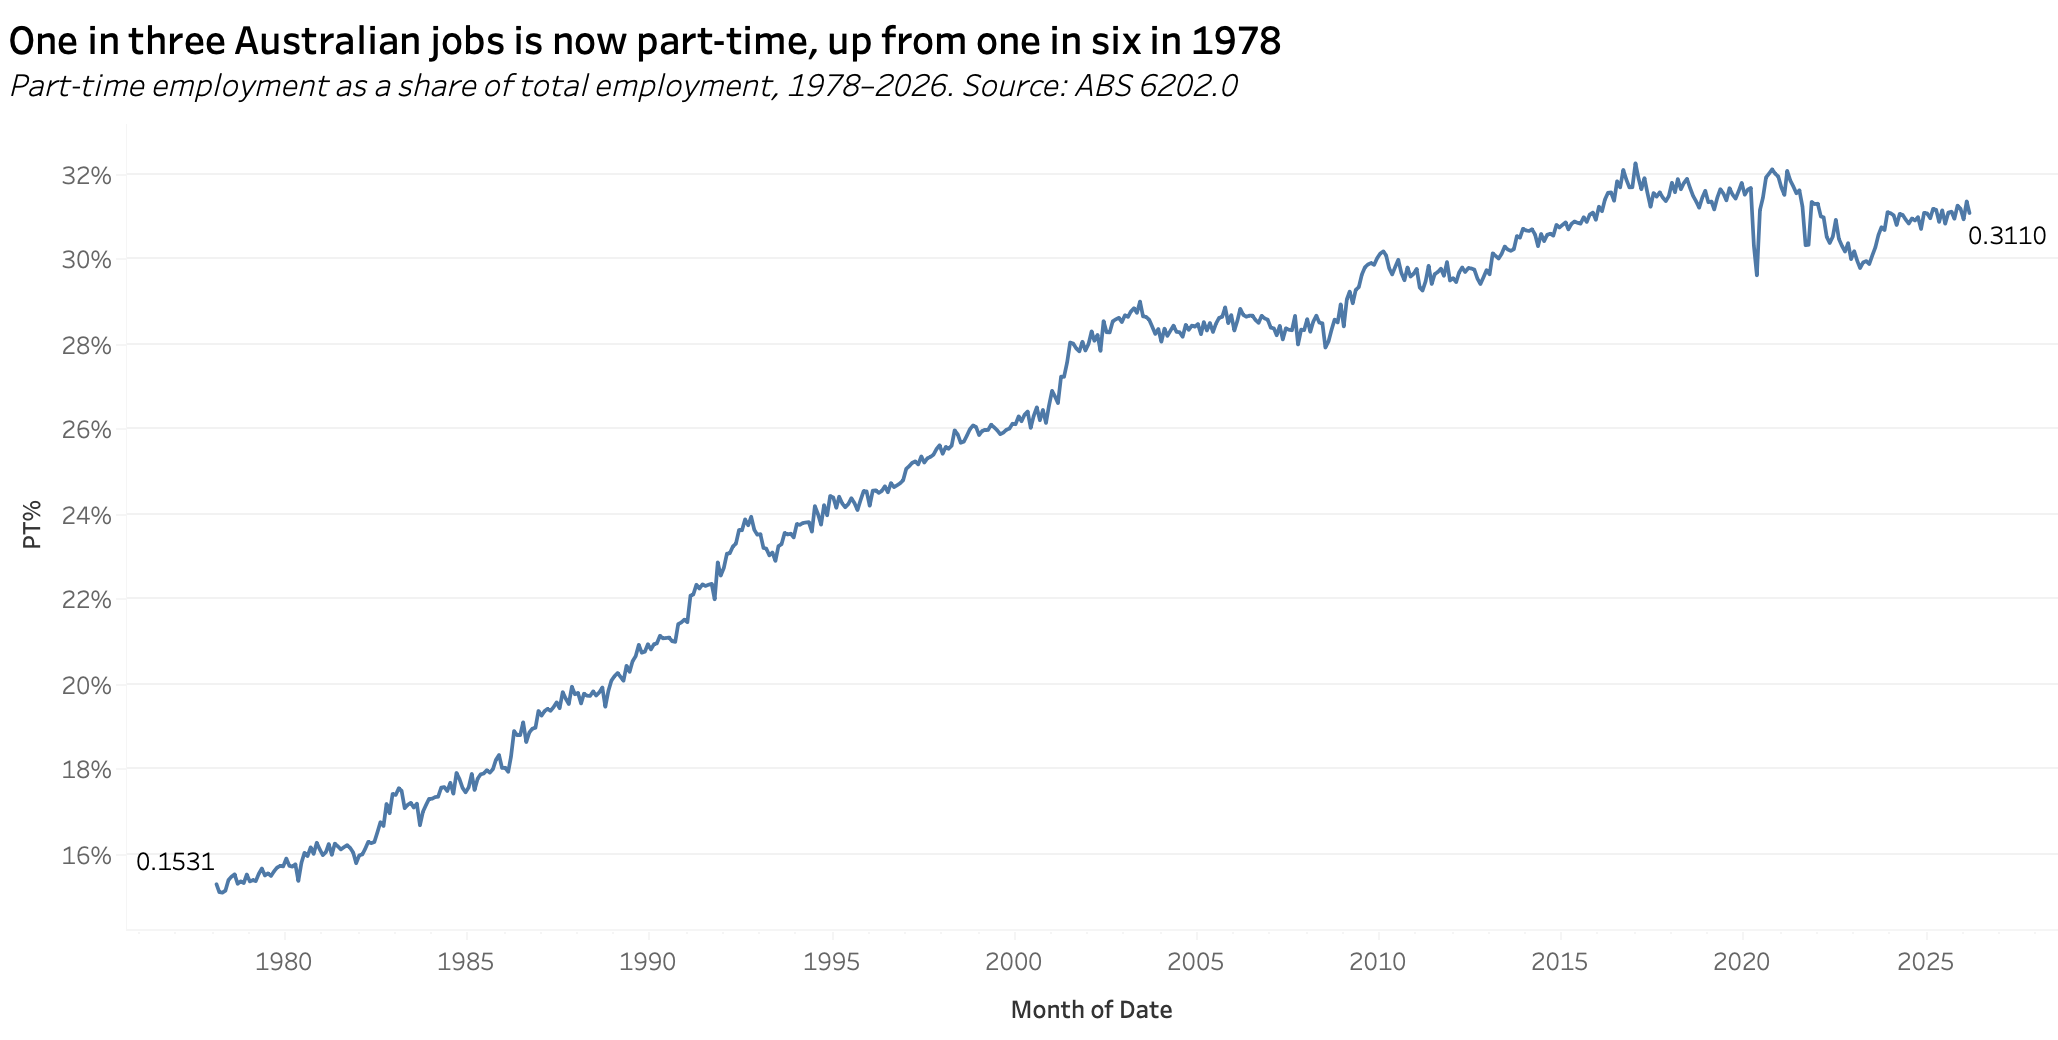
In 1978, about one in six Australian jobs was part-time. Today, it is closer to one in three. This is a structural transformation driven by three forces that reshaped the Australian economy:
Women enter the workforce: Female labour force participation climbed from 44% in 1978 to over 63% today, and much of that growth came through part-time roles that allowed women to balance paid work with unpaid caregiving responsibilities. The jobs that absorbed this wave of new workers were disproportionately part-time.
The shift from manufacturing to services: In the late 1970s, manufacturing was one of Australia’s largest employers, and those jobs were overwhelmingly full-time. As the economy moved toward health care, education, hospitality, and aged care, the nature of available work changed with it. These service industries operate on shift-based, irregular hours that lend themselves to part-time arrangements. RBA has noted that this shift is one of the primary demand-side drivers of part-time growth.
Education: In 1980, about 30% of 15 to 24 year olds were enrolled in full-time study. Today, it is over 50%. Government reforms in the late 1980s expanded access to higher education, and more young Australians now work part-time while studying before transitioning to full-time work in their mid-twenties. Among workers under 25, the part-time share has risen dramatically from 15% to over 50%.
On the other wise, multiple job-holding rate has risen steadily too from about 6.0% pre-COVID to 6.5% today. That is roughly one in 15 workers, up from one in 17.
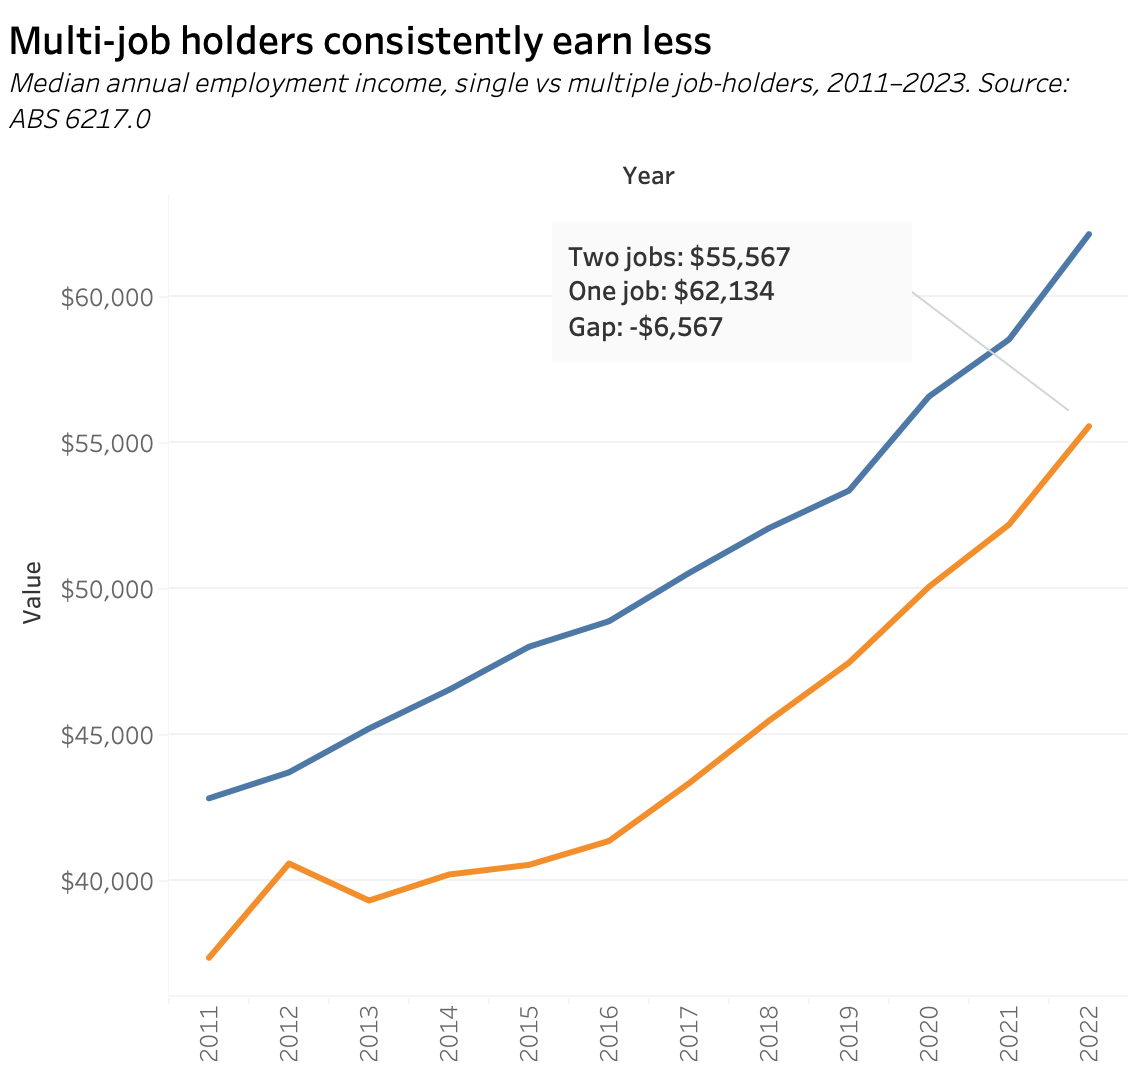
More revealing is what those second jobs actually pay. ABS income data shows that multiple job-holders consistently earn less than single job-holders, about $55,500 versus $62,100 in median annual income as of 2022 to 2023.
In practice, this means a person working two part-time jobs is doing more commuting, managing two rosters, and juggling two sets of expectations, for less total pay than someone in a single full-time role. The second job does not close the income gap. It adds complexity without adding financial security.
This is not a story about individual hustle. It is a story about what the labour market offers. When the fastest-growing sectors are structured around shift work and irregular hours, the result is more people stitching together a working week from fragments rather than holding one stable position. The rise in multiple job-holding tells us more about the structure of available work than it does about the people doing it.
The migration question
This is the section that generates the most heat online. The claim is simple: migrants are taking jobs from Australians. It is also the claim where the gap between perception and data is widest.
Before looking at the labour market data, it is worth acknowledging what is true. Australia’s overseas-born population has grown rapidly, reaching 31.5% of the total population in 2024, up from 23% two decades ago. That is a significant demographic shift, and it is reasonable for people to have questions about how it affects the job market. The question is whether the data supports the specific claim that migrants are displacing Australian-born workers.
When unemployment is broken down by country of birth, the pattern is not what most people expect:
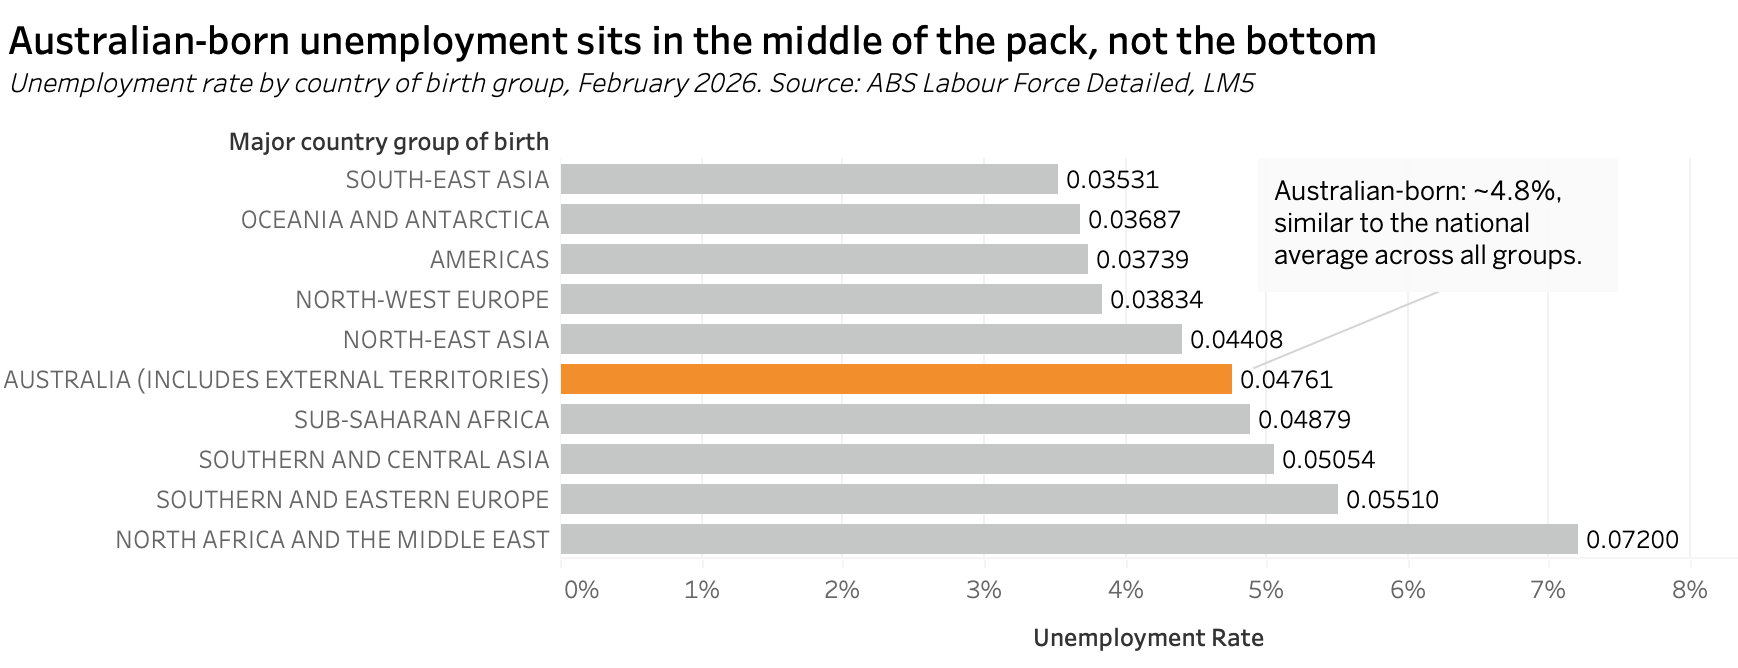
Australian-born workers have an unemployment rate of 4.8%, which places them roughly in the middle of all groups.
Several migrant groups, including those born in South-East Asia, New Zealand, and the Americas, have lower unemployment rates than Australian-born workers.
The group with the highest unemployment rate is those born in the Middle East and North Africa at 7.2%, but even that figure is not dramatically above the national average.
The data does not show migrants outcompeting locals for jobs. If anything, it shows a labour market where outcomes are broadly similar across most groups, with some migrant communities doing slightly better and others slightly worse.
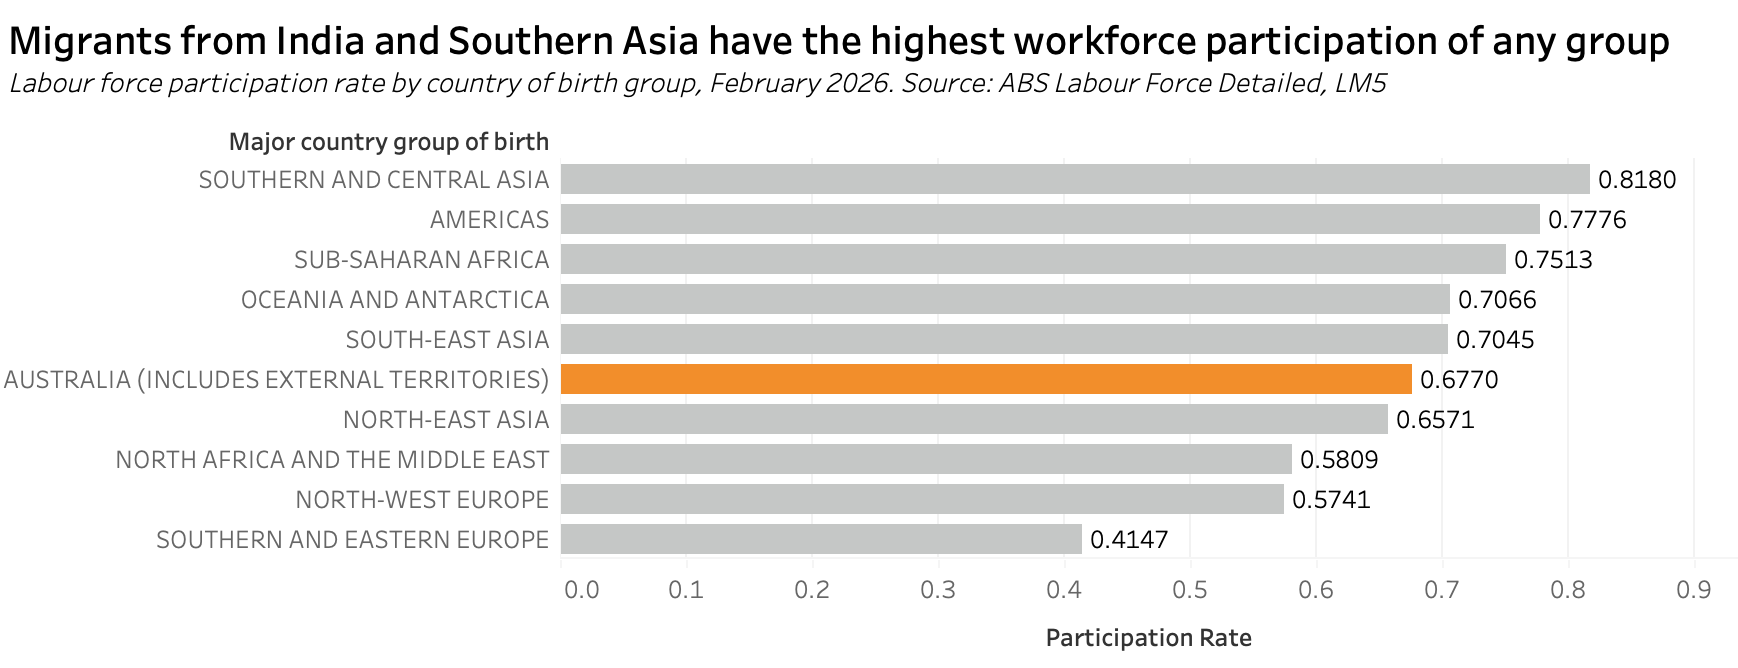
Participation rates tell an even more striking story:
Migrants from India and Southern Asia have the highest workforce participation of any group at 81.8%, fourteen percentage points above the Australian-born rate of 67.7%. Workers born in South-East Asia, Sub-Saharan Africa, the Americas, and New Zealand also participate at higher rates than those born in Australia.
At the other end, those born in Southern and Eastern Europe have the lowest participation at 41.5%, followed by those born in the UK, Ireland and North-West Europe at 57.4%. But these numbers reflect demographics, not willingness to work. These are among the oldest migration waves in Australian history. Many arrived between the 1950s and 1970s and are now in their seventies and eighties. Their low participation rate is a retirement story, not an employment one.
There is a structural explanation for why the newest migrant groups participate at such high rates. Australia’s skilled migration system is designed to select working-age people with qualifications the economy needs. A person entering on a skilled visa is, by definition, someone who has been assessed as employable. The participation data reflects this policy working as intended: the fastest-growing migrant populations are also the most economically active.
None of this means migration has no labour market effects. Rapid population growth puts pressure on housing, infrastructure, and services in ways that people experience directly, and those pressures are real. But the specific claim that migrants are taking jobs from Australian-born workers does not hold up when you look at the employment data. Australian-born unemployment sits in the middle of the pack. Migrant unemployment is broadly similar, sometimes higher, sometimes lower. And the groups growing fastest are also the ones working the most.
The labour market did not shrink to make room for migrants. It grew. Total employment in Australia increased by 1.7 million people between 2020 and 2025. That growth accommodated both Australian-born and overseas-born workers. The pie got bigger.
ABS Labour Force Survey (Cat. 6202.0)
ABS Multiple Job-holders (Cat. 6217.0)
ABS Labour Force Detailed — LM5
ABS: Underemployment and underutilisation — introducing the u-series
RBA: The Rising Share of Part-time Employment (2017)
RBA: The Changing Composition of the Australian Workforce (2002)
National Skills Commission: Trends in participation by gender